A Smooth Introduction to Linear Regression and its Implementation in PyTorch (Part-I)
Linear regression is a statistical method used to model the linear relationship between a dependent variable and one or more independent variables. It is a simple but powerful concept that can be used to make predictions and understand the underlying relationships in a dataset. Let us go through an example to understand the concept better.
I will throw some random data here and see what happens. Say that we have two variables h and r that refer to the time of the day and the number of pages a person reads, respectively.
Let’s assume that the person starts reading at 9:00 AM and finishes at 2:00 PM. We will denote the hours as hour 0 for 9:00 AM, hour 2 for 10:00 AM, and so forth:

The table below will now show the time of the day h and the number of pages r the person reads in each hour.

This is how the data looks like in an h-r plane:
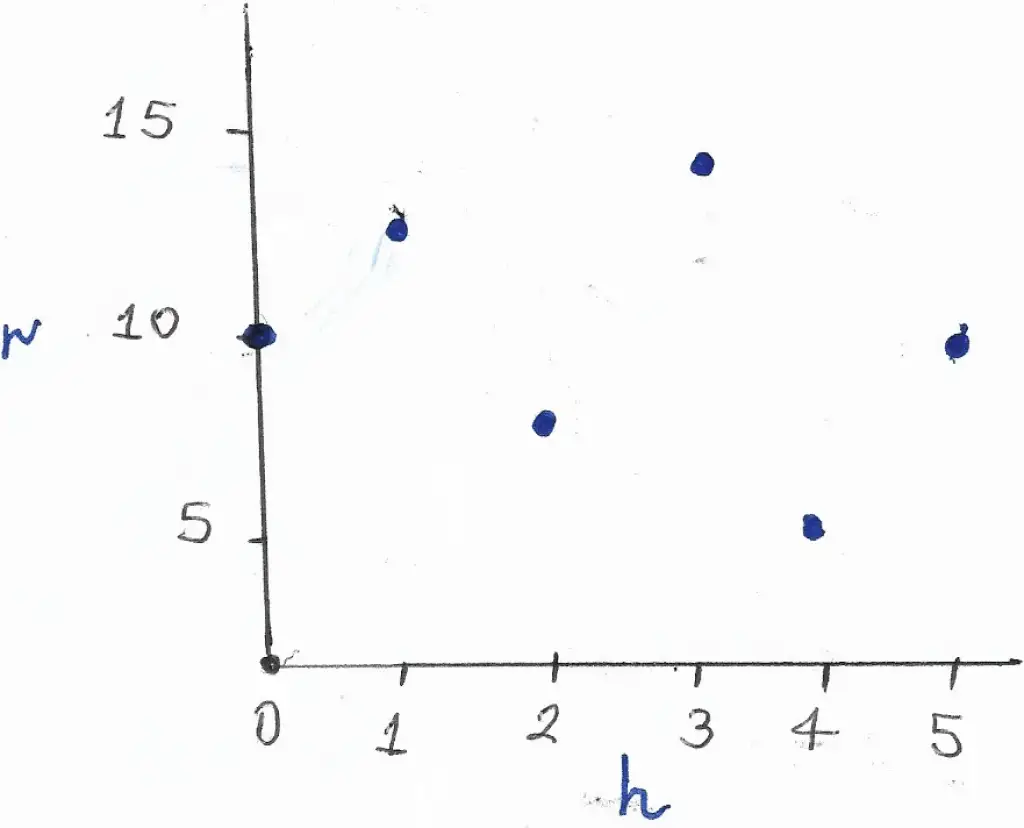
So, for instance, at time 1 (10 AM) the person read 12 pages.
We want to find the linear relationship between the two variables h and r. This can be done by finding the equation of the line that best fits the data points (h,r). This equation represents the line that is closest to all of the points in the h-r plane. This is the main idea behind linear regression!
We can measure the difference between the line and the data points by the distance from each point to the line, which we refer to as the deviation. To find the best fit line, we want to minimize the sum of the squares of these deviations. In other words, we want to find the line that is as close as possible to all of the data points.
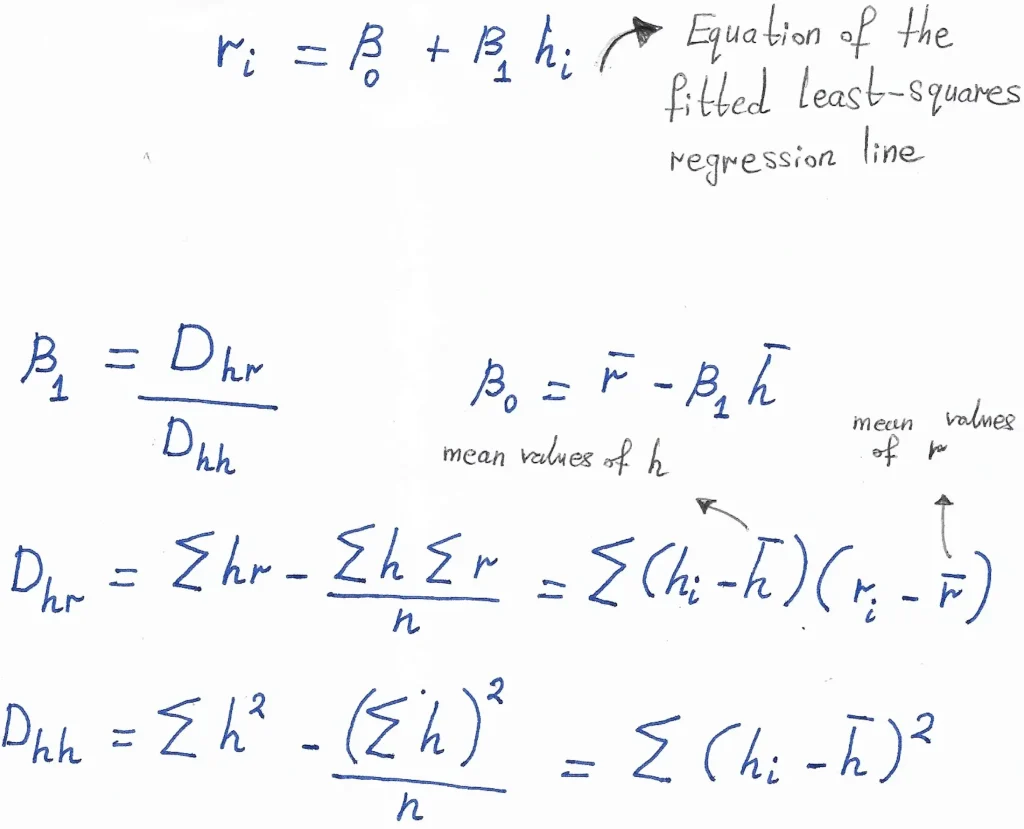
I will now list some formulas we will be using to find the equation of the best fit line.
Let’s now go ahead and substitute our values (h and r) in the aforementioned formulas.
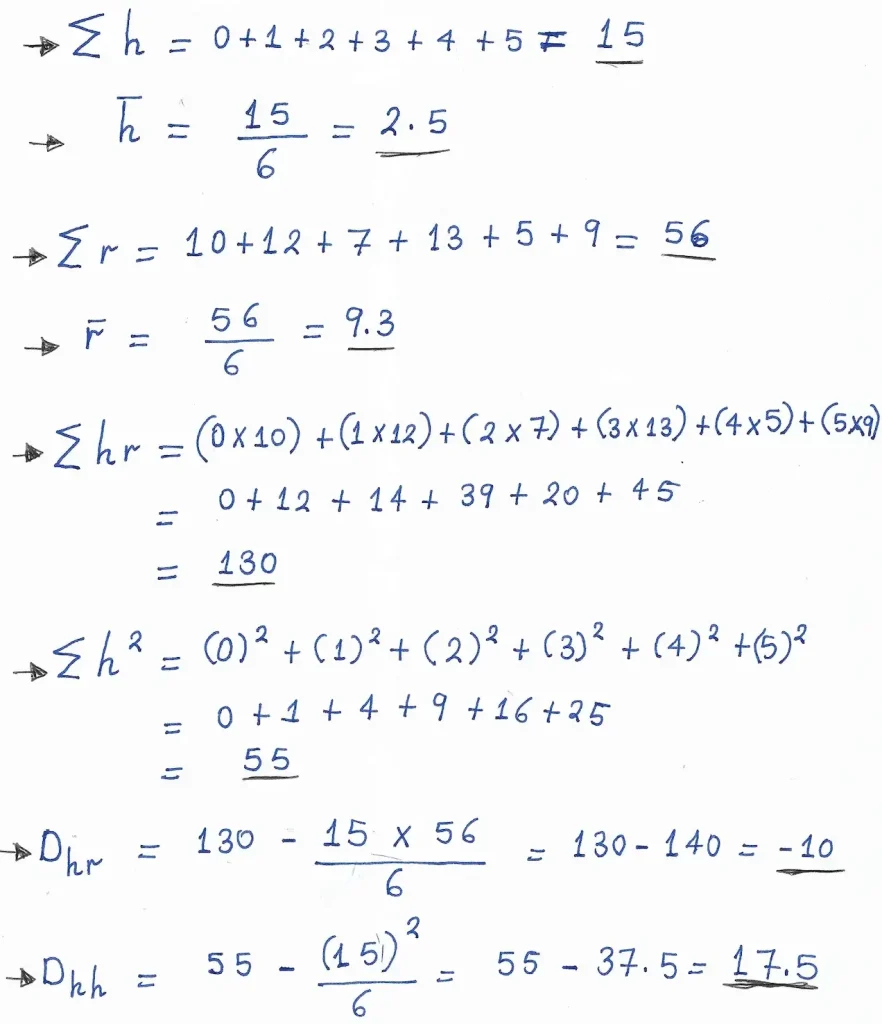
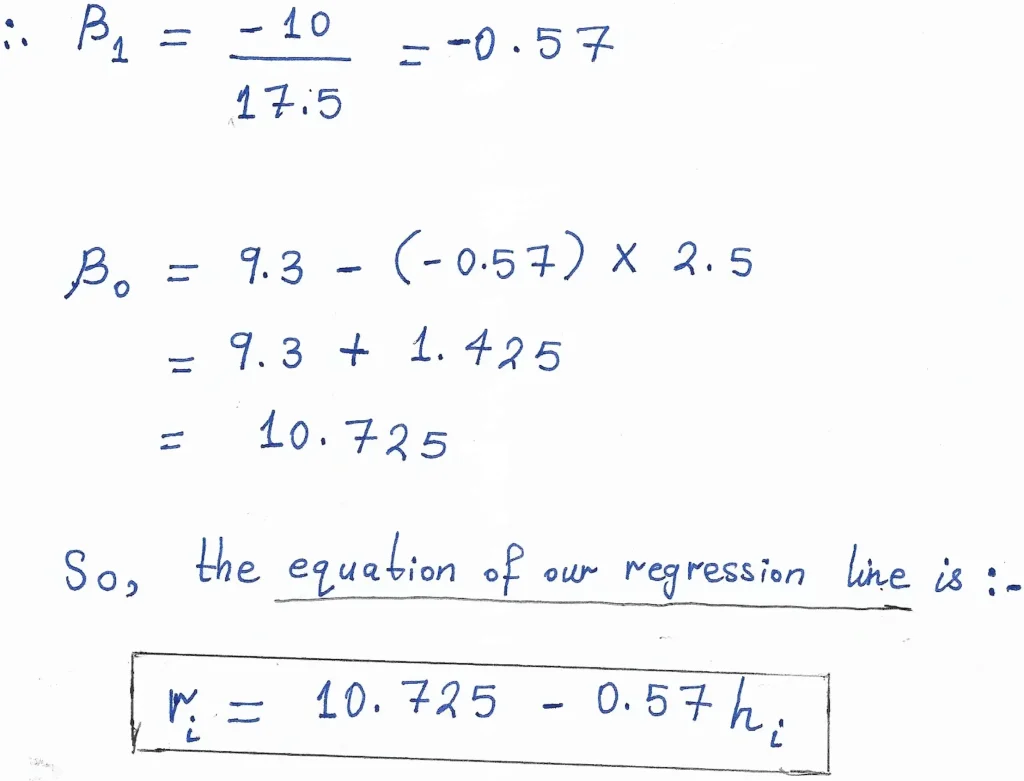
Awesome! Didn’t I tell you it is a simple yet powerful method?
This was a simple walkthrough of how linear regression works and how it finds our best fit line. I know the example might have been more realistic if we set the pages to increase incrementally along the hours, but I think you got the main idea at least, which is the main goal of this post.
In the second part of this tutorial I will be showing you how we can implement the above example in PyTorch!

